Data Sharing
Your clinical dataset can be uploaded into POD-Vis to be shared among a small team of collaborators or more widely across your research community.
Meta Analyses
POD-Vis can be used to combine datasets from one or more studies to create meta-analyses, once the data are harmonized.
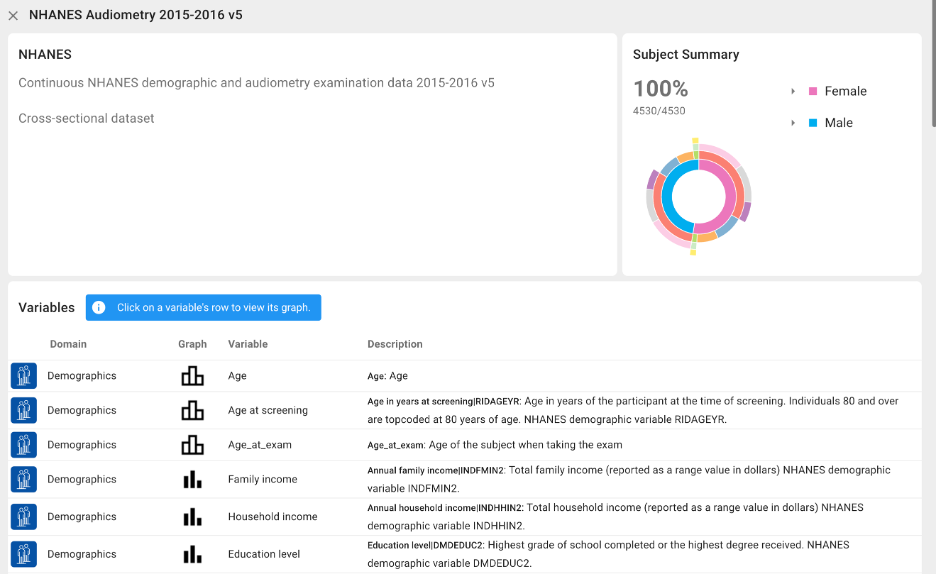
Data Sub-Sets
A major strength of POD-Vis is the ease of creating data sub-sets:
- smaller more focused datasets and
- diverse study groups based on demographic and clinical variables.
Analysis Types
You can create outcomes-based analyses where you ask:
What baseline features explain differences in a selected outcome?
Or you can create predictor-based analyses where you ask:
How do outcomes differ between different clinical subgroups?
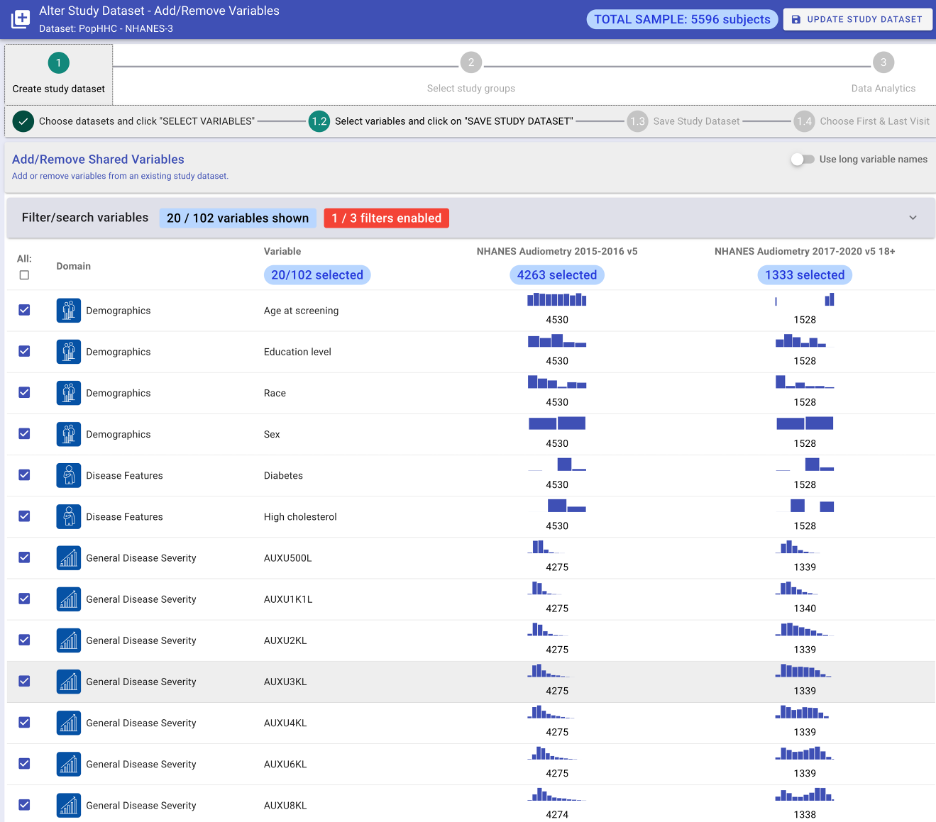
Study Group Creation
You can create one or more study groups (cohorts) from your study dataset and save these for subsequent analyses. POD-Vis provides a graphical interface for users to easily filter data using one or more variables to create and save study groups. As you filter the data, all charts are dynamically updated using brushing-and-linking technology.
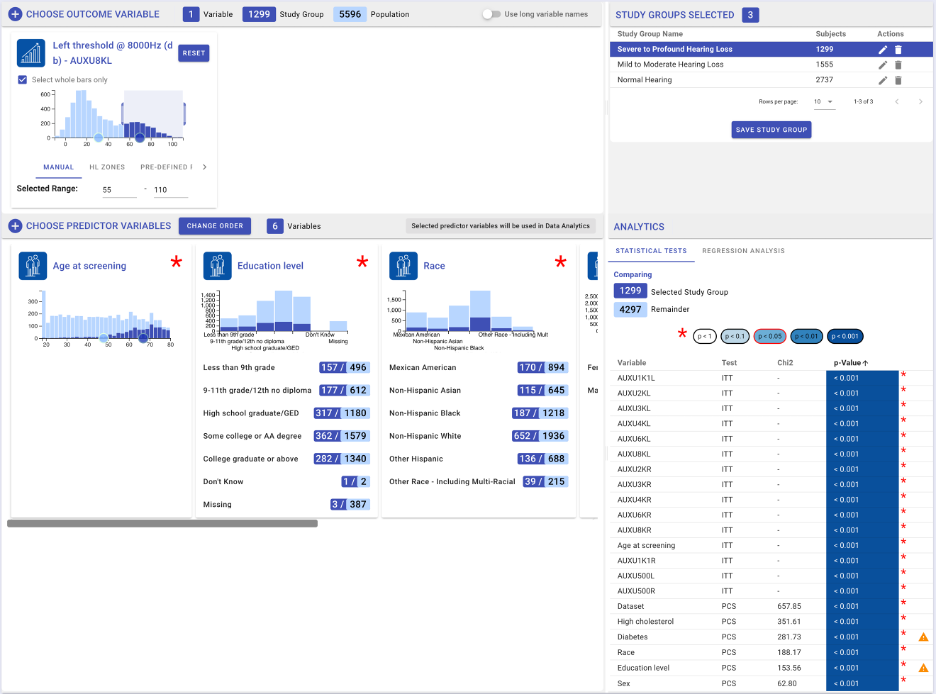
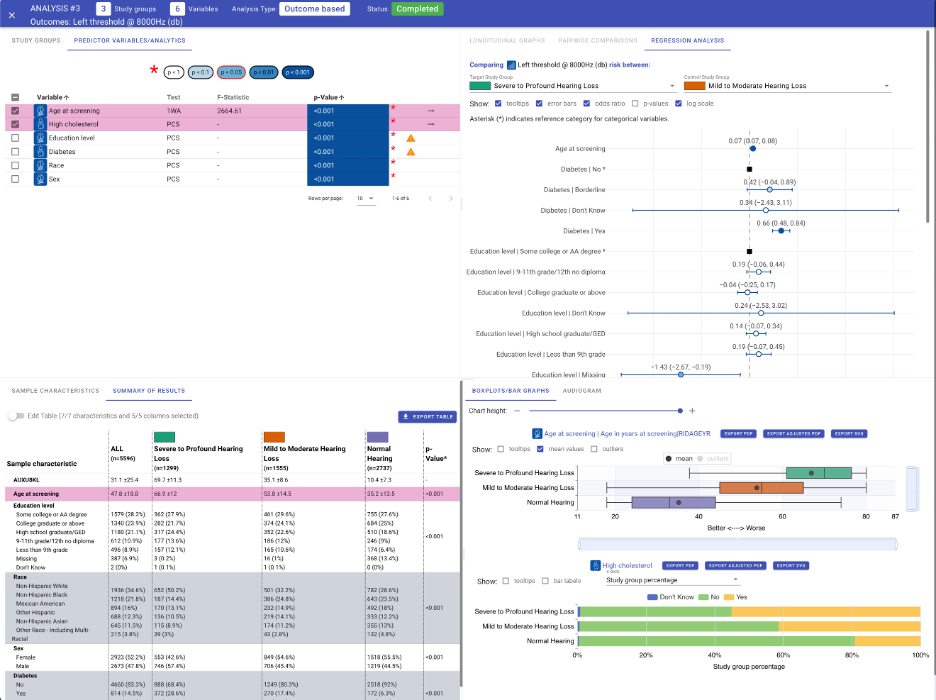
Data Analysis
POD-Vis allows users to explore and understand the differences in two or more of the study groups. POD-Vis provides descriptive statistics including mean, median, standard deviation, performs statistical tests (ANOVA, Mann-Whitney U, Chi-square, univariate regression), and shows graphs (line graphs, histograms, spaghetti plots, bar lots, box plots, Forest plots) to understand the differences between study groups for hypotheses generation.
Ease of Use
POD-Vis was designed for ease-of-use by non-data scientists and data scientists alike. The platform has an easy-to-follow step-by-step tracker to guide you through your query. No training needed! Other built-in help features include:
- Hover text
- Help mode with more detailed guidance
- Computerized wizards
- Automated analyses